Mostrando entradas con la etiqueta GLOBAL WARMING. Mostrar todas las entradas

sábado, 12 de abril de 2014

Las probabilidades de un calentamiento global natural son casi nulas/The odds of a natural global warming are almost null

Variación media de la temperatura en función de la concentración de CO2/Mean temperature variation as a function of CO2 concentration (Taken from Scaling fluctuation analysis and statistical hypothesis testing of anthropogenic warming)

El análisis estadístico descarta la hipótesis de un calentamiento natural con más de un 99 % de certeza.
Un análisis de los datos de temperatura registrados desde 1500, descarta prácticamente la posibilidad de que el calentamiento global producido en la era industrial sea sólo una fluctuación natural del clima de la tierra, de acuerdo con un nuevo estudio realizado por Shaun Lovejoy, profesor de Física en la Universidad McGill (California, E.E.U.U.)
El estudio, publicado en línea el 6 de abril en la revista Climate Dynamics, utiliza un nuevo enfoque para estudiar si el calentamiento global en la era industrial, se debe a las emisiones originadas por la quema de combustibles fósiles a gran escala. En lugar de utilizar complicados modelos informáticos para estimar los efectos de las emisiones de gases de efecto invernadero, Lovejoy examina los datos históricos para comparar la otra posible hipótesis: que el calentamiento registrado en el último siglo se deba a variaciones naturales a largo plazo de la temperatura.
Según Lovejoy "este estudio será un duro golpe para los que aún niegan el cambio climático. El estudio emplea métodos estadísticos para determinar la probabilidad de que el calentamiento global desde 1880 se debe a una variabilidad natural. La conclusión es que dicha hipótesis - calentamiento natural- puede ser descartada con un nivel de confianza superior al 99%, y puede que superior incluso al 99,9 % . "
Para evaluar la variabilidad natural antes de la interferencia humana, el estudio utiliza las "reconstrucciones multi- proxy de clima ", desarrolladas por los científicos en los últimos años para estimar temperaturas históricas, así como técnicas de análisis de fluctuación tomadas de la geofísica no lineal. Las reconstrucciones climáticas tienen en cuenta una serie de indicadores que se encuentran en la naturaleza, como son los anillos de árboles, testigos tomados en el hielo y sedimentos lacustres. Las técnicas de análisis de fluctuaciones permiten comprender las variaciones de temperatura a lo largo de escalas de tiempo más grandes.
Para la era industrial, Lovejoy utiliza el dióxido de carbono, procedente de la quema de combustibles fósiles, como único indicador de los efectos humanos sobre el clima, una simplificación justificada por la estrecha relación entre la actividad económica global y la emisión de gases de efecto invernadero y la contaminación por partículas, y añade: "esto permite que el nuevo enfoque incluya implícitamente el efecto de enfriamiento causado por las partículas de polvo contaminante, que todavía están mal cuantificadas en los modelos de ordenador " .
Aunque el estudio no utiliza los grandes modelos informáticos de uso común por los científicos para estimar la magnitud del futuro cambio climático, las conclusiones de Lovejoy complementan las del Panel Intergubernamental de Expertos sobre el Cambio Climático (IPCC). Lovejoy predice, con una confianza del 95 %, que una duplicación de los niveles de dióxido de carbono en la atmósfera produciría un calentamiento de entre 2,5 y 4,2 grados Celsius. Dicho rango es más preciso- aunque está en línea con él, que el predicho por el IPCC que indica que las temperaturas subirían entre 1,5 y 4,5 grados centígrados si las concentraciones de dióxido de carbono se duplicaran.
"Hemos tenido una fluctuación de la temperatura media, simplemente enorme desde 1880, del orden de 0,9 grados Celsius ", dice Lovejoy . "Este estudio demuestra que las probabilidades de que eso se deba a fluctuaciones naturales, son inferiores al uno por ciento. Y puede que al uno por mil"
 "Aunque el rechazo estadístico de una hipótesis, no puede ser utilizada para concluir la certeza de cualquier alternativa específica, en muchos casos - incluido éste - el rechazo de una aumenta en gran medida la credibilidad de la otra"

Statistical analysis rules out natural-warming hypothesis with more than 99% certainty
An analysis of temperature data since 1500 all but rules out the possibility that global warming in the industrial era is just a natural fluctuation in the earth’s climate, according to a new study by McGill University physics professor Shaun Lovejoy.
The study, published online April 6 in the journal Climate Dynamics, represents a new approach to the question of whether global warming in the industrial era has been caused largely by man-made emissions from the burning of fossil fuels. Rather than using complex computer models to estimate the effects of greenhouse-gas emissions, Lovejoy examines historical data to assess the competing hypothesis: that warming over the past century is due to natural long-term variations in temperature.
“This study will be a blow to any remaining climate-change deniers,” Lovejoy says. Lovejoy’s study applies statistical methodology to determine the probability that global warming since 1880 is due to natural variability. His conclusion: the natural-warming hypothesis may be ruled out “with confidence levels great than 99%, and most likely greater than 99.9%.”
To assess the natural variability before much human interference, the new study uses “multi-proxy climate reconstructions” developed by scientists in recent years to estimate historical temperatures, as well as fluctuation-analysis techniques from nonlinear geophysics. The climate reconstructions take into account a variety of gauges found in nature, such as tree rings, ice cores, and lake sediments. And the fluctuation-analysis techniques make it possible to understand the temperature variations over wide ranges of time scales.
For the industrial era, Lovejoy’s analysis uses carbon-dioxide from the burning of fossil fuels as a proxy for all man-made climate influences – a simplification justified by the tight relationship between global economic activity and the emission of greenhouse gases and particulate pollution, he says. “This allows the new approach to implicitly include the cooling effects of particulate pollution that are still poorly quantified in computer models,” he adds.
While his new study makes no use of the huge computer models commonly used by scientists to estimate the magnitude of future climate change, Lovejoy’s findings effectively complement those of the International Panel on Climate Change (IPCC), he says. His study predicts, with 95% confidence, that a doubling of carbon-dioxide levels in the atmosphere would cause the climate to warm by between 2.5 and 4.2 degrees Celsius. That range is more precise than – but in line with -- the IPCC’s prediction that temperatures would rise by 1.5 to 4.5 degrees Celsius if CO2 concentrations double.
“We’ve had a fluctuation in average temperature that’s just huge since 1880 – on the order of about 0.9 degrees Celsius,” Lovejoy says. “This study shows that the odds of that being caused by natural fluctuations are less than one in a hundred and are likely to be less than one in a thousand.
“While the statistical rejection of a hypothesis can’t generally be used to conclude the truth of any specific alternative, in many cases – including this one – the rejection of one greatly enhances the credibility of the other.”


Tomado de/Taken from McGill University

Resumen del artículo/Abstract of the paper
Scaling fluctuation analysis and statistical hypothesis testing of anthropogenic warming
S. Lovejoy
Climate Dynamics, April 2014. DOI: 10.1007/s00382-014-2128-2
Abastract
Although current global warming may have a large anthropogenic component, its quantification relies primarily on complex General Circulation Models (GCM’s) assumptions and codes; it is desirable to complement this with empirically based methodologies. Previous attempts to use the recent climate record have concentrated on “fingerprinting” or otherwise comparing the record with GCM outputs. By using CO2 radiative forcings as a linear surrogate for all anthropogenic effects we estimate the total anthropogenic warming and (effective) climate sensitivity finding: ΔT anth = 0.87 ± 0.11 K, λ2xCO2,eff=3.08±0.58K . These are close the IPPC AR5 values ΔT anth = 0.85 ± 0.20 K and λ2xCO2=1.5−4.5K (equilibrium) climate sensitivity and are independent of GCM models, radiative transfer calculations and emission histories. We statistically formulate the hypothesis of warming through natural variability by using centennial scale probabilities of natural fluctuations estimated using scaling, fluctuation analysis on multiproxy data. We take into account two nonclassical statistical features—long range statistical dependencies and “fat tailed” probability distributions (both of which greatly amplify the probability of extremes). Even in the most unfavourable cases, we may reject the natural variability hypothesis at confidence levels >99 %.

lunes, 14 de octubre de 2013

Al cambio climático golpeará primero los trópicos/Extreme climate will hurts tropics first

Año en que la temperatura media anual superará a la mayor temperatura media de los años 1860-2005

En el año 2047 la temperatura media del  planeta superará a cualquiera registrada en la historia reciente. A partir de ese momento, hasta un año de los fríos será más cálido que cualquier año cálido del periodo 1860 a 2005. Esto sucederá si los países continúan emitiendo dióxido de carbono como lo hacen ahora. Y las nuevas temperaturas extremas no se producirán en el Ártico, sino en los trópicos, donde las personas, las plantas y los animales salvajes están menos preparados para adaptarse. Este inquietante análisis proviene de un nuevo y masivo estudio liderado por Camilo Mora de la Universidad de Hawaii en Manoa, publicado recientemente en Nature.
El informe comienza reconociendo que la temperatura anual media mundial fluctúa de año en año, aunque en general, lleva subiendo desde el comienzo de la revolución industrial. Si no se hace nada, la temperatura en 2047 superará incluso a la temperatura anual más alta conocida desde 1860 hasta 2005. Si se recortan de forma agresiva las emisiones, esa fecha se retrasará hasta 2069. Mora y sus colegas han utilizado datos de 39 modelos climáticos diferentes con dos escenarios diferentes: seguir como hasta ahora (lo que conduce a la fecha de 2049) y la mitigación agresiva de emisiones (la fecha de 2069). Esos dos mismos escenarios son las piedras angulares de la nueva evaluación del clima, publicada recientemente por el Grupo Intergubernamental de Expertos sobre el Cambio Climático.
El equipo de Mora también estudió los efectos sobre otras seis variables: temperatura superficial del agua de mar, evaporación, flujo de calor, pH oceánico, precipitación y transpiración (humedad emitida por las plantas). Después generaron un mapa para cada variable mostrando la fecha de superación de la temperatura en todo el mundo.
Según Mora, el resultado más sorprendente es que "los efectos más tempranos y más extremos sucederán en los trópicos y no en el Ártico”, donde se centran nuestras preocupaciones. Esto se debe a que, en los trópicos, las variaciones naturales de las temperaturas del aire y del océano y de otras variables climáticas son muy pequeñas, por lo que cambios relativamente menores llevarán estas condiciones fuera de sus límites. Como resultado, dice Mora, las plantas y animales tropicales sufrirán un mayor stress, ya que las especies acostumbradas a vivir con fluctuaciones tan estrechas no podrán adaptarse con la suficiente rapidez a unos cambios climáticos rápidos y sin precedentes. En los trópicos viven la mayoría des las especies mundiales. Por lo que la biodiversidad global sufrirán un duro golpe.
En las latitudes tropicales se encuentran muchos de los países con ingresos más bajos, que probablemente deberán luchar para adaptarse al nuevo y extremado clima. El estudio concluyendo diciendo que "Esto sugiere que cualquier avance para reducir el ritmo del cambio climático en curso requerirá un mayor compromiso por parte de los países desarrollados para reducir sus emisiones, pero también requerirá una financiación más amplia de programas sociales y de conservación en los países en desarrollo, para reducir al mínimo el impacto del cambio climático".
Una cuestión interesante, sobre todo para los políticos, es saber si las fechas de 2047 y 2069 son seguras. Después de todo, esas fechas se obtienen con los datos de solo 145 años, los que van desde 1860 hasta 2005. Según Mora, la incertidumbre de los cálculos para el 2047 es de más/menos tres años y para el 2069 de aproximadamente cuatro años. Para una mayor rigurosidad, el equipo investigador hizo el mismo análisis empleando los últimos 1.000 años de temperaturas globales y encontró que cada una de las dos fechas aumentaba solo dos años. La razón, según Mora, es que en 145 años "hay los suficientes puntos extremos para producir una curva fiable a largo plazo".


Año en que la temperatura media del mar superará a la mayor temperatura media de los años 1860-2005

By the year 2047 the mean air temperature around the planet will shift completely out of the range seen in recent history. From that point on, even a cold year will be warmer than any warm year from 1860 to 2005 if nations continue to emit carbon dioxide the way they do now. And the new extreme temperatures—the new normal—will first occur not in the Arctic but in the tropics, where people, plants and wildlife are least equipped to adapt. That disquieting analysis comes from a massive new study led by Camilo Mora at the University of Hawaii at Mānoa, recently published in Nature.
The report begins with the recognition that the annual mean global air temperature fluctuates from year to year, even though it has been climbing overall since the industrial revolution began. If the world does nothing new, then the temperature by 2047 will exceed even the highest annual temperature from 1860 to 2005. If the world aggressively cuts back on emissions, then the date will be delayed until 2069. Mora and his colleagues crunched data from 39 different climate models that feed two future scenarios: business as usual (leading to the 2049 date) and aggressive mitigation (the 2069 date). The same two scenarios are cornerstones of the new climate assessment released recently by the International Panel on Climate Change.
Mora’s team also ran the exercise for six other variables: sea-surface water temperature, evaporation, heat flux, ocean pH, precipitation and transpiration (moisture emitted by plants). They then generated a map for each variable showing when the date of departure occurs for all places around the world.
The surprising revelation is that “the earliest and most extreme effects will happen in the tropics,” Mora says, and not in the Arctic, where so much concern is focused. That’s because the natural variation in air and ocean temperatures and other climate-related variables in the tropics is very small, so only relatively minor changes will push these conditions out of bounds. As a result, Mora says, tropical plants and animals will be stressed the most, because species accustomed to living within such narrow fluctuations will not be able to adapt quickly enough to such unprecedented and rapid climate changes. More of the world’s species live in the tropics than anywhere else, so global biodiversity will be hit hard.
Many of the world’s low-income nations are also located at tropical latitudes, and they are likely to struggle to adapt to the new extreme climate. As the paper concludes: “This suggests that any progress to decrease the rate of ongoing climate change will require a bigger commitment from developed countries to decrease their emissions but will also require more extensive funding of social and conservation programs in developing countries to minimize the impacts of climate change.”
One question for policy makers is whether the years 2047 and 2069 are firm transition points. After all, those departure dates are compared with only a 145-year period, from 1860 to 2005. Mora says the uncertainty of the calculations for 2047 is plus or minus three years and for 2069 is about four years. To add further rigor Mora’s team ran the same analysis against the last 1,000 years of global temperatures and found that each of the two temperature departure dates only increases by two years. The reason, Mora says, is that in 145 years “you pick up enough extremes to give a reliable long-term curve.”

Tomado de/Taken from Scientific American

Resumen de la publicación/Abstract of the paper
The projected timing of climate departure from recent variability
Camilo Mora, Abby G. Frazie, Ryan J. Longman, Rachel S. Dacks, Maya M. Walton, Eric J. Tong, Joseph J. Sanchez, Lauren R. Kaiser, Yuko O. Stender, James M. Anderson, Christine M. Ambrosino, Iria Fernandez-Silva, Louise M. Giuseffi and Thomas W. Giambelluca
Nature, 502, 183–187 (10 October 2013) doi:10.1038/nature12540
Abstract
Ecological and societal disruptions by modern climate change are critically determined by the time frame over which climates shift beyond historical analogues. Here we present a new index of the year when the projected mean climate of a given location moves to a state continuously outside the bounds of historical variability under alternative greenhouse gas emissions scenarios. Using 1860 to 2005 as the historical period, this index has a global mean of 2069 (±18 years s.d.) for near-surface air temperature under an emissions stabilization scenario and 2047 (±14 years s.d.) under a ‘business-as-usual’ scenario. Unprecedented climates will occur earliest in the tropics and among low-income countries, highlighting the vulnerability of global biodiversity and the limited governmental capacity to respond to the impacts of climate change. Our findings shed light on the urgency of mitigating greenhouse gas emissions if climates potentially harmful to biodiversity and society are to be prevented.

sábado, 3 de agosto de 2013

La realidad del Calentamiento Global/The reality of Global Warming


Tomado directamente de la NASA:
¿Cómo ha cambiado la temperatura de la superficie de la Tierra? Para verlo,  los científicos han recopilado las temperaturas registradas desde 1880 en más de 1000 estaciones meteorológicas en todo el mundo, y las han combinado con modernos datos satelitales. El video  resume los resultando al mostrar los cambios de temperatura producidos a lo largo de 130 años, con respecto a los valores medios del siglo XX. En el mapa, rojo significa más caliente y   azul más frío. La película demuestra que, en promedio, la temperatura superficial de la Tierra ha aumentado casi un grado Celsius (centígrado) a lo largo de 130 años, y que la mayoría de los años más cálidos registrados han sido los más recientes. El cambio climático global es más que un pasatiempo científico pasajero: está ligado al empeoramiento global del clima y al aumento de los niveles marinos costeros.
Sin comentarios...


Taken directly from NASA:
How has the surface temperature of Earth been changing? To help find out, Earth scientists collected temperature records from over 1000 weather stations around the globe since 1880, and combined them with modern satellite data. The above movie dramatizes the result showing 130 years of planet-wide temperature changes relative to the local average temperatures in the mid-1900s. In the above global maps, red means warmer and blue means colder. On average, the display demonstrates that the temperature on Earth has increased by nearly one degree Celsius over the past 130 years, and many of the warmest years on record have occurred only recently. Global climate change is of more than passing interest -- it is linked to global weather severity and coastal sea water levels.
No words required...

Tomado de/Taken from Nasa
Viñeta original de/Cartoon from Lemon

domingo, 17 de marzo de 2013

Los contaminantes amenazan la salud en el Artico/Pollutants threaten health in the Artic


Las personas que viven en las zonas árticas pueden ser más sensibles a los contaminantes debido a su genética, según Arja Rautio investigador del Centro de Medicina del Ártico en la Universidad de Oulu, Finlandia. Esto es lamentable, ya que las zonas más septentrionales de Europa están expuestas a los productos químicos más peligrosos. Los científicos creen que el cambio climático puede ser una de los culpables ya que los movimientos de las masas de aire y agua empujan algunos de estos indeseables productos químicos hacia el Ártico. "En la vida real, la gente está expuesta a un montón de productos químicos", dice Rautio, que estudia los efectos de los contaminantes en la salud humana y la influencia del cambio climático, dentro del proyecto ArcRisk financiado por la UE ", y creo que la gente del norte está expuesta en general a niveles más altos que la población europea".
Muchos nuevos contaminantes como los compuestos fluorados y bromados y bisfenol A pueden actuar sobre las hormonas y tienen por tanto impacto sobre la salud humana. Pero el ver este efecto en los seres humanos, a nivel de población, podría tomar diez o incluso 20 años, especialmente en el caso del cáncer. Por esto, ArcRisk ha recopilado una base de datos sobre niveles de concentración y tendencias de los contaminantes en los seres humanos. El equipo investigador analizó bifenilos policlorados (PCB), pesticidas clorados y difeniléteres polibromados (PBDE) en muestras congeladas de sangre recogidas en Noruega en 1978, 1986, 1995 y 2008.
El principal reto que enfrentan los científicos del proyecto es diferenciar los efectos de los productos contaminantes de lo que hacemos en nuestra vida cotidiana. "Sabemos que las dioxinas pueden llevar a más diabetes y presión arterial alta", dice Rautio, "pero hay muchos otros factores implicados. Estamos cambiando nuestra dieta y muchos de nosotros somos menos activos y este estilo de vida también puede aumentar el riesgo de enfermedades como la diabetes. "Los resultados del proyecto se presentarán en enero 2014, en una conferencia sobre Fronteras del Ártico en Tromsø, Noruega.
Los problemas de salud provocados por estas sustancias químicas podrían ser peores de lo previsto. Algunos de los contaminantes encontrados en el Ártico por los científicos del proyecto, tales como los compuestos fluorados, tienen mayor afinidad por los receptores hormonales quelas mismas hormonas naturales.Los estudios en animales muestran tendencias preocupantes y no presagian nada bueno para los seres humanos. Según Geir Wing Gabrielsen, científico medioambiental del Instituto Polar Noruego que no forma parte del proyecto ArcRisk: "Cuando vemos estos resultados en animales del Ártico, nos preocupa mucho lo que vamos a encontrar en lo que respecta a los humanos". Señala además que grandes masas de aire caliente están siendo transportados al Ártico y que las corrientes marinas alrededor de lugares como las islas Svalbard [a medio camino entre Noruega y el Polo Norte] contienen aguas atlánticas más cálidas, cuando antes eran aguas polares.
Rautio concluye en que es necesario clarificar estos efectos, para que la gente y no sólo en aquellos que viven en las remotas zonas del norte, pueda tomar decisiones sobre sus propias vidas, qué comer o cómo evitar la exposición a estos peligros.

People living in Arctic areas can be more sensitive to pollutants due to their genetics, says researcher Arja Rautio at the Centre for Arctic Medicine in the University of Oulu, Finland. This is unfortunate since the northernmost areas of Europe are receiving more harmful chemicals. Scientists believe climate change may be a culprit as air and water mass movements push some of these undesirable chemicals towards the Arctic. “In real life, people are exposed to lots of chemicals,” says Rautio, who leads studies into the human health effects from contaminants and the influence of climate change in a EU-funded project called ArcRisk, “and I think the people of the north are exposed to higher levels than for example the general population in Europe.”
Many new contaminants like fluorinated and brominated compounds and bisphenol A can act on hormones and so have impacts on human health. But seeing an effect on humans, at the population level, could take ten or even 20 years, especially in the case of cancer, she adds. This is why ArcRisk has established a database containing data on concentration levels and trends of contaminants in humans. The project team analysed frozen blood samples collected in Norway in 1978, 1986, 1995 and 2008 for polychlorinated biphenyls (PCBs), chlorinated pesticides and polybrominated diphenylethers (PBDEs).
The main challenge that project scientists struggle with is to disentangle the effects of contaminant chemicals from what we do in our everyday lives. “We know that dioxins can lead to more diabetes and high blood pressure,” says Rautio, “but there are many other confounding factors. We are changing our diet and many of us are less active and those lifestyle choices can also increase the risk of diseases like diabetes.” The results of the project are due to be presented at a conference of Arctic Frontiers in Tromsø, Norway, in January 2014

Health problems induced by these chemicals could be worse than anticipated. Some of the pollutants found in the Arctic by the project scientists like the fluorinated compounds have higher affinities for hormone receptors than even the natural hormones.Animal studies already show worrying trends that do not bode well for humans. “When we see these findings in Arctic animals I am very concerned about what we will find with regards to humans” says Geir Wing Gabrielsen, an environmental scientist at the Norwegian Polar Institute, who is not part of ArcRisk. He notes that long periods of warm air are being transported to the Arctic and that the sea currents around places like the Svalbard islands [located midway between Norway and the North Pole] now consist of warmer Atlantic water; they used to consist of polar waters.
Rautio concludes that there is a need to clarify the effects so that people—not only in those living in the remote northern areas— can make decisions about their own lives, what to eat, how to avoid exposure to harm.

Tomado de/Taken from Youris.com

domingo, 4 de noviembre de 2012

La Corriente del Golfo podría estar liberando metano/Gulf Stream might be releasing seafloor methane


Una buena parte del carbono biológico de la Tierra está almacenado en el fondo del mar en forma de hidrato de metano, un compuesto clatrato sólido, de fórmula CH4.5,8-6,0H2O, en el que el metano está atrapado dentro de una estructura cristalina de agua, formando un sólido parecido al hielo. Originalmente se pensaba que solo podría formarse en las regiones exteriores del sistema solar, donde la temperatura es baja y el hielo de agua es común, pero se han encontrado depósitos importantes bajo los sedimentos del fondo oceánico terrestre.
Los cambios en la temperatura o la dirección de la Corriente del Golfo, que transporta agua cálida hacia el norte desde el Golfo de México, han calentado en 8 grados Celsius los sedimentos en una franja a lo largo del fondo marino del Atlántico Norte, desbloqueando 2.500 millones de toneladas métricas de metano de su reservorio en las aguas profundas, según informan los científicos en el número del 25 de octubre de Nature.
Según Benjamin Phrampus (Southern Methodist University de Dallas, Texas), coautor del estudio, este es el primer estudio que sugiere que el derretimiento del hidrato de metano está relacionado con las corrientes oceánicas mismas. Los anteriores estudios suponían que la ruptura del hidrato de metano se produciría por el aumento de la temperatura global del océano, lo que necesitaría una enorme cantidad de energía. Según Phamprus "No necesitamos esta enorme cantidad de energía para explicarlo. Se trata simplemente de un cambio en las corrientes oceánicas”.
La conversión de los hidratos de metano en gas metano, no es tan apocalíptica como los efectos causados por el ‘ice-nine’ (hielo-nuevo) en la novela de Kurt Vonnegut “Cat’s Cradle” (Juego de Hilos) de 1963, un compuesto que cristaliza toda el agua líquida que toca y que tiene el poder de aniquilar, en un instante, toda la vida en la Tierra. Aunque el metano es un gas de efecto invernadero mucho más potente que el CO2, la mayor parte del mismo que está siendo liberado en las profundidades, nunca llegará a la atmósfera. En su lugar, se disolverá en el agua de mar, donde los microbios lo convertirán en CO2, pero incluso, aunque el metano llegara a la superficie, su tiempo de vida en el aire sería solo de unos 10 años.
Según Carolyn Ruppel del Servicio Geológico de EE.U, para afectar al calentamiento global habría que añadir mucho más metano a la atmósfera. Lo que sería un problema, según Ruppel, es si eso hace las pendientes submarinas mucho más propensas a los deslizamientos, que podrían a su vez liberar aún más metano de los fondos marinos o provocar tsunamis.
La liberación repentina de hidrato de metano, es una de las causas propuestas para eventos de calentamiento global como el máximo térmico del Paleoceno-Eoceno: un aumento repentino de más de 5 grados Celsius de la temperatura global, que se produjo hace unos 55 millones de años. En comparación con ese evento, la cantidad de gas liberada en la costa este de EE.UU. es muy pequeña, dice Phrampus, pero añade que "es muy poco probable que ésta sea la única parte del mundo donde se produzcan."
El estudio se ha basado en mediciones indirectas de la temperatura del fondo marino para inferir que los hidratos se están desintegrando. Estos sólidos de metano sólo pueden formarse en los primeros cientos de metros superiores de los sedimentos oceánicos. Por debajo, el interior caliente de la Tierra mantiene el metano gaseoso. Las señales sísmicas revelan la profundidad donde los hidratos sólidos y el metano gaseoso se encuentran. La comparación de esta profundidad con las predicciones teóricas, parece sugerir que la región era probablemente más fría en el pasado, pero los cambios producidos hace 5.000 años en la corriente del Golfo están causando que se caliente.
Es como ver un bloque de hielo en un día caluroso y soleado: se puede inferir que el hielo se derrite incluso aunque no se le vea. Por una lógica similar, a partir del aumento de la temperatura de los sedimentos los científicos sospechan que una gran parte del metano congelado debe estar vaporizándose, aunque no lo observen directamente.
Los hidratos de metano se descompondrán a lo largo de los próximos siglos, si la Corriente del Golfo no se enfría o cambia su posición. Sin embargo, el impacto sobe el clima mundial sigue siendo poco claro, ya que los científicos no saben cuánto hidrato de metano hay, o cuanto gas podría ser liberado.


A good portion of the biological carbon on Earth is stored in the seafloor as methane hydrate, a solid clathrate compound, composition CH4 . 5.8-6.0 H2O, in which a large amount of methane is trapped within a crystal structure of water, forming a solid similar to ice. Originally thought to occur only in the outer regions of the Solar System where temperatures are low and water ice is common, significant deposits of methane clathrate have been found under sediments on the ocean floors of Earth.
Changes in the temperature or direction of the Gulf Stream, which carries warm water north from the Gulf of Mexico, have heated sediments in a strip along the North Atlantic seafloor by 8 degrees Celsius, unlocking 2.5 billion metric tons of methane from deep-sea caches, scientists report in the Oct. 25 Nature.
This is the first study to suggest that methane hydrate melting is related to ocean currents themselves, says study coauthor Benjamin Phrampus (Southern Methodist University in Dallas). Previous studies suggested that the global ocean temperature would have to increase to cause hydrate breakdown, which would take a very huge input of energy, he says. “We don’t need this large amount of energy to explain this. It’s simply a change in the ocean currents.”
The conversion of methane hydrate to gas isn’t nearly so apocalyptic as the effects caused by ‘ice-nine’ (in Kurt Vonnegut’s 1963 novel Cat’s Cradle, that crystallizes all liquid water it touches, with the power to wipe out all life on Earth in an instant. though. While methane is a much more potent greenhouse gas than CO2, at the depths it’s being released most of the methane will never reach the atmosphere. Instead, it will dissolve in seawater, where microbes will guzzle it up and convert it to CO2. Even if methane does reach the surface, its lifetime in air is only about 10 years.
To affect global warming, “you’d have to add quite a bit of methane” says geophysicist Carolyn Ruppel of the U.S. Geological Survey. Where it becomes a problem, Ruppel says, is if this conversion makes underwater slopes much more prone to landslides. These slides might release even more methane from the seabed or trigger tsunamis.
Sudden methane hydrate release has been proposed as the cause of global warming events like the Paleocene-Eocene thermal maximum, a rapid spike in global temperature of more than 5 degrees Celsius that occurred about 55 million years ago. Compared with the PETM, the amount of gas being released by hydrates off of the U.S. east coast is very small, says Phrampus, but he notes that “it’s very unlikely that this is the only part of the world where it’s occurring.”
The study relied on indirect measurements of seafloor temperature to infer that hydrates are disintegrating. These methane solids can form only in the top few hundred meters of ocean sediments. Below that, the Earth’s warm interior keeps methane a gas. Seismic signals revealed the depth where solid hydrates met gassy methane. Comparing this depth with theoretical predictions suggested that the region was probably cooler in the past, but changes in the Gulf Stream 5,000 years ago are causing it to heat up.
It’s like seeing a block of ice on a warm, sunny day: you can infer that the ice is melting even if you can’t see it. By similar logic, from rising sediment temperatures scientists suspect that a big chunk of the frozen methane must be vaporizing, even without observing it directly.
Methane hydrates will be breaking down over the next few centuries if the Gulf Stream doesn’t cool off or shift its position. Because scientists don’t know how much methane hydrate is out there or how much gas could be released, however, the impact on global climate remains unclear.

Tomado de/Taken from Science News

Resumen de la publicación/Abstract of the paper
Recent changes to the Gulf Stream causing widespread gas hydrate destabilization
B.J. Phrampus & M.J. Hornbach
Nature 490, 527–530 (25 October 2012)
doi: 10.1038/nature11528
Abstract
The Gulf Stream is an ocean current that modulates climate in the Northern Hemisphere by transporting warm waters from the Gulf of Mexico into the North Atlantic and Arctic oceans. A changing Gulf Stream has the potential to thaw and convert hundreds of gigatonnes of frozen methane hydrate trapped below the sea floor into methane gas, increasing the risk of slope failure and methane release. How the Gulf Stream changes with time and what effect these changes have on methane hydrate stability is unclear. Here, using seismic data combined with thermal models, we show that recent changes in intermediate-depth ocean temperature associated with the Gulf Stream are rapidly destabilizing methane hydrate along a broad swathe of the North American margin. The area of active hydrate destabilization covers at least 10,000 square kilometres of the United States eastern margin, and occurs in a region prone to kilometre-scale slope failures. Previous hypothetical studies3, 5 postulated that an increase of five degrees Celsius in intermediate-depth ocean temperatures could release enough methane to explain extreme global warming events like the Palaeocene–Eocene thermal maximum (PETM) and trigger widespread ocean acidification7. Our analysis suggests that changes in Gulf Stream flow or temperature within the past 5,000 years or so are warming the western North Atlantic margin by up to eight degrees Celsius and are now triggering the destabilization of 2.5 gigatonnes of methane hydrate (about 0.2 per cent of that required to cause the PETM). This destabilization extends along hundreds of kilometres of the margin and may continue for centuries. It is unlikely that the western North Atlantic margin is the only area experiencing changing ocean currents; our estimate of 2.5 gigatonnes of destabilizing methane hydrate may therefore represent only a fraction of the methane hydrate currently destabilizing globally. The transport from ocean to atmosphere of any methane released—and thus its impact on climate—remains uncertain.

jueves, 23 de agosto de 2012

Record de superficie mínima de hielo en el Artico/Artic Sea ice extent low record


La superficie de hielo derretida en el Ártico durante las dos primeras semanas de agosto, está por debajo de los niveles más bajos alcanzados en 2007. Este descenso coincidió con una intensa tormenta originada sobre el Océano Ártico central, pero no está claro si es la causa de este rápido deshielo.

El 13 de agosto de 2012, el hielo ártico tenía una extensión de 5,09 millones de kilómetros cuadrados, es decir 2,69 millones de kilómetros cuadrados por debajo de la media de los años 1979-2000, y 483.000 millones menos que el record de 2007, el más bajo conocido. Este descenso se debe a la gran abertura al Atlántico del Mar de Beauford y, a causea de la rápida pérdida de hielo de las pasadas dos semanas, al Mar Siberiano Oriental. Solo en la costa nororiental de Groenlandia, la situación es normal. El hielo cercano a la costa en Siberia oriental sigue bloqueando el paso en la ruta del Mar del Norte y la entrada occidental al Paso del Noroeste, por el estrecho de McClure, sigue cerrada.

La pérdida de hielo desde junio ha sido muy rápida a razón de 100.000 kilómetros cuadrados diarios. Sin embargo, la velocidad se dobló durante unos días a primeros de agosto, debido a un ciclón ártico. Al contrario que en el verano de 2007, cuando había altas presiones en el Océano Ártico central y bajas presiones en la costa norte euroasiática, el verano de 2012 se ha caracterizado por tener condiciones climáticas cambiantes. Las temperaturas del aire a altitudes de 925 hPa (cerca de 1.000 m sobre el nivel del agua) han sido entre 1 y 3 grados Celsius mayores que la media de 1981 a 2012 en el centro de Groenlandia, norte de Canadá y la parte norte de Alaska hacia el Océano Ártico. Temperaturas por debajo de lo normal (entre 1 y 2 grados Celsius) se observaron en una pequeña región de Siberia oriental cerca del Mara Siberiano oriental, lo que ayuda a explicar la persistencia de bajos niveles de hielo en esta región a primeros de agosto.

Véase también el post anterior


Arctic sea ice extent during the first two weeks of August continued to track below 2007 record low daily ice extents. Sea ice extent dropped rapidly between August 4 and August 8. While this drop coincided with an intense storm over the central Arctic Ocean, it is unclear if the storm prompted the rapid ice loss.

Arctic sea ice extent on August 13 was 5.09 million square kilometers (1.97 million square miles). This is 2.69 million square kilometers (1.04 million square miles) below the 1979 to 2000 average extent for the date, and is 483,000 square kilometers (186,000 square miles) below the previous record low for the date, which occurred in 2007. Low extent for the Arctic as a whole is driven by extensive open water on the Atlantic side of the Arctic, the Beaufort Sea, and—due to rapid ice loss over the past two weeks—the East Siberian Sea. Ice is near its normal (1979 to 2000) extent only off the northeastern Greenland coast. Ice near the coast in eastern Siberia continues to block sections of the Northern Sea Route. The western entrance to the Northwest Passage via McClure Strait remains blocked.

The average pace of ice loss since late June has been rapid at just over 100,000 square kilometers (38,000 square miles) per day. However, this pace nearly doubled for a few days in early August during a major Arctic cyclonic storm. Unlike the summer of 2007 when a persistent pattern of high pressure was present over the central Arctic Ocean and a pattern of low pressure was over the northern Eurasian coast, the summer of 2012 has been characterized by variable conditions. Air tempertures at the 925 hPa level (about 3000 feet above the ocean surface) of 1 to 3 degrees Celsius (1.8 to 5.4 degrees Fahrenheit) above the 1981 to 2012 average have been the rule from central Greenland, northern Canada, and Alaska northward into the central Arctic Ocean. Cooler than average conditions (1 to 2 degrees Celsius or 1.8 to 3.6 degrees Fahrenheit) were observed in a small region of eastern Siberia extending into the East Siberian Sea, helping explain the persistence of low concentration ice in this region through early August.

See also the previous post

Tomado de/Taken from National Snow and Ice Data Center

domingo, 29 de abril de 2012

La salinidad de los océanos ha cambiado en los últimos cincuente años/Oceans' salinity changed over last half-century

Como se puede ver en la Figura de arriba, durante la segunda mitad del siglo XX algunas zonas del océano (en rojo) se hicieron más salinas mientras que otras (en azul) se hicieron más dulces, al aumentar la cantidad de agua que se evapora desde la superficie y cae en forma de lluvia.
La culpa podría ser del calentamiento del planeta. Las simulaciones llevadas a cabo en un estudio publicado en Science (27 de Abril) por Durack y col. sugieren que la evaporación y las precipitaciones aumentaron un 4 por ciento al aumentar medio grado centígrado la temperatura de la superficie. El aumento provocado es mayor del que que preveían anteriores estudios, pero encaja con la idea de que una atmósfera más cálida puede retener más humedad.
"Vemos grandes patrones generales de cambio", dice Paul Durack, oceanógrafo del Laboratorio Nacional Lawrence Livermore en California. "Las regiones en las que predominó la evaporación se hicieron más saladas, mientras que las regiones en los que predominó la lluvia el agua se hizo más dulce".
La medida de estos cambios globales en la evaporación y el ciclo de la lluvia en la Tierra, nunca ha sido fácil. Los pluviómetros terrestres o marinos suelen ser escasos y no siempre se conoce su posición exacta en décadas pasadas.
Según William Ingram, físico atmosférico en el Met Office Hadley Centre en Exeter y la Universidad de Oxford en Inglaterra, "la comparación de momentos diferentes momentos es difícil ya que tenemos más y mejores datos para los últimos tiempos.”. Según este mismo experto, la salinidad del océano proporciona una formar bastante estable y fiable para medir la cantidad de agua que entra y sale del mismo. Las pequeñas fluctuaciones que se producen en la evaporación y la precipitación, tienden a ser suavizadas con el tiempo, permitiendo así los científicos encontrar tendencias a largo plazo.
El equipo de Durack analizó 1,7 millones de medidas de salinidad realizadas desde barcos durante la segunda mitad del siglo XX. Otros investigadores ya habían visto patrones de cambio en estos datos, pero Durack y sus colaboradores and reforzado la imagen. Una red de boyas autónomas desplegadas en el siglo XXI ha ayudado a rellenar los vacíos en el registro, sobre todo en latitudes altas, en las que las tormentas invernales impiden entrar a los barcos.
Mientras que el aumento de los niveles de gases con efecto invernadero continúe calentando la Tierra, el ciclo del agua será más rápido. Se estima que cada grado extra aumentará un 8 por ciento la cantidad de agua movida.
Y lo que ocurre en los océanos no se queda en los océanos. El ciclo que tiene lugar sobre el agua se extiende sobre la tierra. Según Durack, las zonas del mundo áridas, como Australia, serán probablemente más secas en el futuro, mientras que los lugares húmedos serán más húmedos.

As it can be seen in the first Figure, over the second half of the 20th century, parts of the world’s ocean became saltier (red) and parts became fresher (blue) as the amount of water evaporating from the surface and falling as rain increased.
A warming planet may to blame. Simulations in the new study published by Durack et col. in Science suggest evaporation and rainfall got a 4 percent boost as surface temperatures rose half a degree Celsius. That boost is a bigger change than previous studies had suggested, but fits with the idea that a warmer atmosphere can hold more moisture.
“We see big broad patterns of change,” says Paul Durack, an oceanographer at the Lawrence Livermore National Laboratory in California. “Regions dominated by evaporation became saltier, while regions dominated by rainfall became fresher.”
Measuring such global changes in Earth’s evaporation and rain cycle has never been easy. Rain gauges on land or at sea tend to be sparsely distributed, and the exact positions of such instruments decades ago isn’t always known.
“Comparing different times gets difficult because you typically have more and better data for the later times,” says William Ingram, an atmospheric physicist at the Met Office Hadley Centre in Exeter and the University of Oxford in England. Ocean salinity provides a fairly stable, reliable way to measure how much water goes up and comes down, says Ingram. Small fluctuations in evaporation and rainfall tend to get smoothed out over time, helping scientists to tease out long-term trends.
Durack’s team analyzed 1.7 million salinity measurements made by ships during the second half of the 20th century. Other researchers had already seen patterns of change in these data, but Durack and his colleagues sharpened the picture. A network of autonomous buoys deployed in the 21st century helped to fill in gaps in the record, particularly in high latitudes where winter storms keep ships away.
As rising greenhouse gas levels continue to warm Earth, the water cycle will churn even harder. Every extra degree is estimated to increase the amount of water moving around by 8 percent.
And what happens in the oceans doesn’t stay in the oceans. The cycle that occurs over water extends over land as well. Dry lands across the globe — Australia, for instance — will probably get drier in the future, as wet places get even wetter, says Durack.


Tomado de/Taken from Science News

La Figura central está tomada del material suplementario libre/Central Figure taken from the free Supplementary material


Resumen de la publicación/Abstract del paper
Paul J. Durack, Susan E. Wijffels and Richard J. Matear
Ocean salinities reveal strong global water cycle intensification during 1950 to 2000, Science, 336, 455-458 (2012)
DOI: 10.1126/science.1212222

Abstract
Fundamental thermodynamics and climate models suggest that dry regions will become drier and wet regions will become wetter in response to warming. Efforts to detect this long-term response in sparse surface observations of rainfall and evaporation remain ambiguous. We show that ocean salinity patterns express an identifiable fingerprint of an intensifying water cycle. Our 50-year observed global surface salinity changes, combined with changes from global climate models, present robust evidence of an intensified global water cycle at a rate of 8 ± 5% per degree of surface warming. This rate is double the response projected by current-generation climate models and suggests that a substantial (16 to 24%) intensification of the global water cycle will occur in a future 2° to 3° warmer world.

domingo, 23 de octubre de 2011

Más evidencias del calentamiento global/More evidences for the global warming


Una argumentación muy frecuente contra el calentamiento global es que el clima ha cambiado siempre y que las temperaturas suben a veces, y que todo es perfectamente natural.
Sin embargo, Svante Björck, que investiga el clima en la Universidad de Lund (Suecia) ha demostrado que el calentamiento global, es decir el aumento simultáneo de temperaturas en los hemisferios norte y sur, no ha tenido lugar en los últimos 20.000 años (14.000 más que en los estudios anteriores) , que es lo más lejos que podemos analizar con suficiente precisión para comparar con lo que ocurre en la actualidad.
Empleando los archivos climáticos, presentes en un gran número de publicaciones científicas, Svante Björck ha buscado evidencias de eventos climáticos que generaran efectos similares simultáneamente en los hemisferios norte y sur. No ha tenido lugar ninguno desde el final de la última Edad de Hielo hace 20.000 años. Al contrario, parece que cuando, por ejemplo, la temperatura aumenta en un hemisferio, disminuye o no cambia en el otro.
A modo de ejemplo, consideremos la Pequeña Edad de Hielo (LIA) que tuvo lugar en los siglos XVII, XVIII y XIX y durante la cual Europa sufrió algunas de las temperaturas más bajas registradas. Los contrarios al cambio climático,  la presentan como un ciclo frío natural que siguió al Periodo de Calentamiento Medieval (MWP) como se muestra en la Figura adjunta. Pero esos datos se refieren únicamente al hemisferio norte. Resulta evidente que el intenso frío tuvo graves consecuencias para la agricultura, las economías de los estados y el transporte en el norte, no hay evidencia de cambios y efectos simultáneos similares en el hemisferio sur. Los archivos climáticos, muestras de sedimentos marinos y lacustres y de hielo de glaciares, que muestran como han variado a lo largo de la historia la temperatura, las precipitaciones y la concentración de gases atmosféricos están repletos de ejemplos similares.
Por el contrario, durante los periodos de ‘calma’, cuando el sistema climático está influido por procesos externos, los investigadores pueden ver que las señales climáticas de los archivos muestran tendencias similares en ambos hemisferios. Según Svante Björck, “esto puede suceder, por ejemplo, cuando un asteroide impacta la tierra o después de una erupción volcánica violenta cuando las cenizas se esparcen por todo el planeta. En estos casos, vemos efectos similares simultáneos en todo el mundo”
El Profesor Björck encuentra paralelismos en la situación actual. Los nivles de gases de efecto invernadero están aumentando muy rápidamente en la actualidad y el calentamiento global tienen lugar al mismo tiempo, y concluye “Mientras no encontremos evidencias de cambios climáticos anteriores que condujeran a efectos similares y simultáneos a escala global, debemos considerar el actual cambio climático como una excepción, causada por la influencia humana en el ciclo del carbono”.


A common argument against global warming is that the climate has always varied. Temperatures rise sometimes and this is perfectly natural is the usual line.
However, Svante Björck, a climate researcher at Lund University in Sweden, has now shown that global warming, i.e. simultaneous warming in the northern and southern hemispheres, have not occurred in the past 20 000 years (14 000 years further back in time than previous studies) which is as far back as it is possible to analyze with sufficient precision to compare with modern developments.
Going through the global climate archives, present in a large number of research publications, Svante Björck has looked for evidence of climate events generating similar effects on both the northern and southern hemispheres simultaneously. None has occurred since the end of the last Ice Age 20 000 years ago. On the contrary, it seems that, for example, the temperature rises in one hemisphere, it falls or remains unchanged in the other.
As an example, let us take the Little Ice Age (LIA), which took place between the years 1600 and 1900. Europe experienced some of its coldest centuries.  The people and researchers against the global warming, present LIA as a natural cold cycle following the Medieval Warming Period (MWP) as can be seen in the joint Figure. But these data refer only to the northern hemisphere. It is evident that the extreme cold had serious consequences for agriculture, state economies and transport in the north, there is no evidence of corresponding simultaneous temperature changes and effects in the southern hemisphere. The climate archives, in the form of core samples taken from marine and lake sediments and glacier ice, serve as a record of how temperature, precipitation and concentration of atmospheric gases and particles have varied over the course of history, and are full of similar examples.
Instead it is during ‘calmer’ climatic periods, when the climate system is influenced by external processes, that the researchers can see that the climate signals in the archives show similar trends in both hemispheres. “This could be, for example, at the time when an asteroid hits the earth or after a violent volcanic eruption when ash is spread across the globe. In these cases we can see similar effects around the world simultaneously”, says Svante Björck.
Professor Björck draws parallels to today’s situation. The levels of greenhouse gases in the atmosphere are currently changing very rapidly. At the same time, global warming is occurring, and concludes “As long as we don’t find any evidence for earlier climate changes leading to similar simultaneous effects on a global scale, we must see today’s global warming as an exception caused by human influence on the earth’s carbon cycle”.

A very interesting interview to Svante Björck (in english only)

Tomado de/Taken from of Lund University

Resumen de la publicación/Abstract of the paper

Current global warming appears anomalous in relation to the climate of the last 20000 years
Svante Björck
Clim Res 48 (2011) 5-11 (available on line)

ABSTRACT: To distinguish between natural and anthropogenic forcing, the supposedly ongoing global warming needs to be put in a longer, geological perspective. When the last ca. 20000 yr of climate development is reviewed, including the climatically dramatic period when the Last Ice Age ended, the Last Termination, it appears that the last centuries of globally rising temperatures should be regarded as an anomaly. Other, often synchronous climate events are not expressed in a globally consistent way, but rather are the expression of the complexities of the climate system. Due to the often poor precision in the dating of older proxy records, such a statement will obviously be met with some opposition. However, as long as no globally consistent climate event prior to today’s global warming has been clearly documented, and considering that climate trends during the last millennia in different parts of the world have, in the last century or so, changed direction into a globally warming trend, we ought to regard the ongoing changes as anomalies, triggered by anthropogenically forced alterations of the carbon cycle in the general global environment.

lunes, 5 de septiembre de 2011

Abiertas rutas en el Artico/Arctic shipping routes open

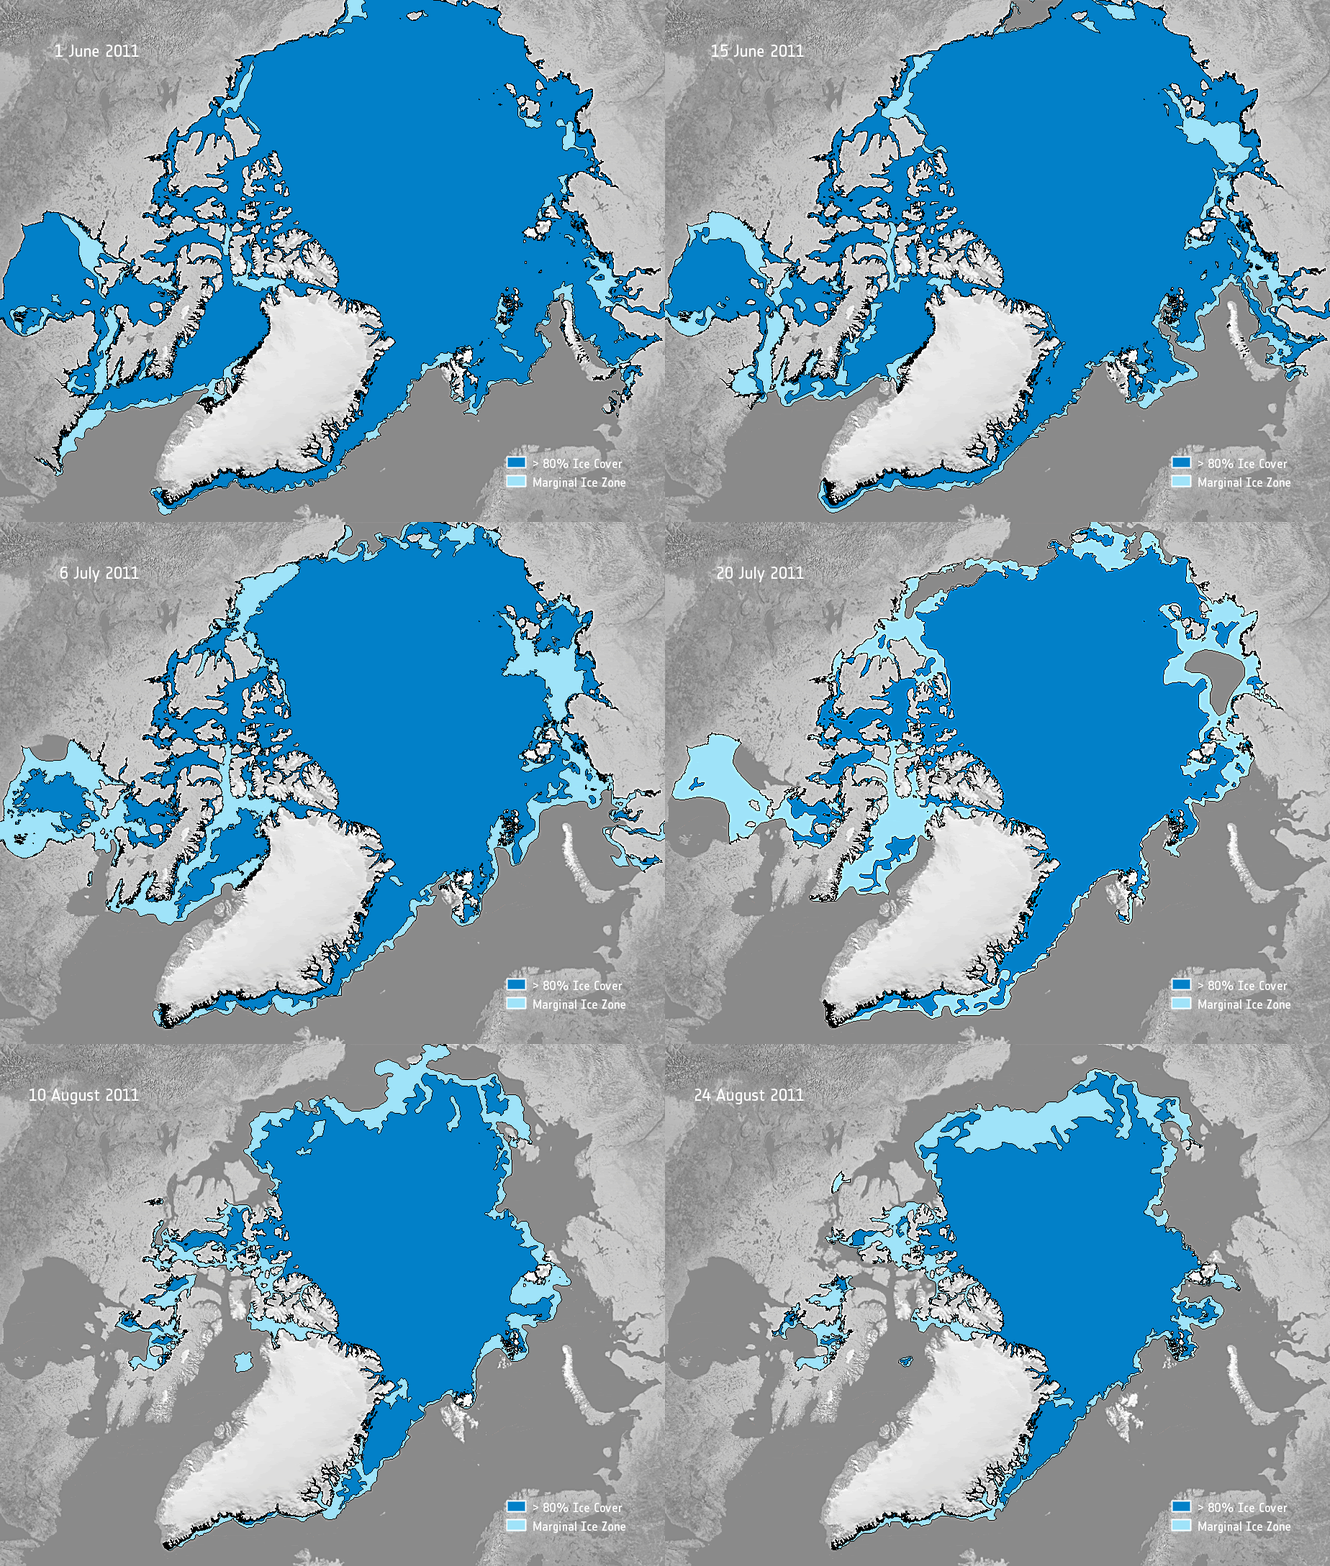
Las observaciones de satélite muestran que se avecina otro año con menos cubierta de hielo en el Ártico de lo habitual. El deshielo durante los meses de verano ha abierto dos grandes vías para la navegación en el Océano Ártico. En 2008 los satélites fueron testigo de la apertura simultánea del Pasaje del Noroeste y la Ruta del Mar del Norte por primera vez desde que comenzaron las observaciones de satélite, en los años setenta; ahora ha ocurrido de nuevo. 
La Ruta del Mar del Norte, por encima de Rusia –también conocida como Paso del Noreste- ha estado abierta al tráfico marítimo desde mediados de agosto; ahora parece estarlo también el Pasaje Noroeste, según revelan observaciones recientes de satélite. Situado en el Archipiélago Ártico Canadiense, el Pasaje del Noroeste puede ser un atajo para la navegación entre Europa y Asia. Sin embargo, la apertura de esta ruta trae consigo potenciales reclamaciones de soberanía y la posibilidad de que especies marinas migren a través del Océano Ártico. 
En 2007 la cubierta helada en el Ártico batió el récord de escasez en casi tres décadas, desde el comienzo de las medidas con satélites. Ese mismo año se abrió por primera vez el pasaje del Noroeste, históricamente no navegable. Las inusuales condiciones climáticas contribuyeron a la pérdida récord de hielo en 2007: el viento llevó aire caliente a la región central del océano Ártico, lo que provocó un fuerte deshielo. 
El clima no se ha comportado igual este año, pero la temprana apertura de las vías de navegación sugiere que podríamos estar a punto de batir un nuevo récord de pérdida de hielo. “Aún faltan tres o cuatro semanas para alcanzar el mínimo de la cubierta de hielo, y lo que ocurra dependerá mucho de las condiciones climáticas en el Ártico estas semanas”, dice Toudal Pedersen, investigador del Instituto Meteorológico Danés. “Pero tanto si alcanzamos un mínimo absoluto como si no, este año se confirma que estamos en una nueva etapa, con mucho menos hielo que antes durante el verano. “Los últimos cinco veranos hemos tenido las cubiertas heladas más escasas jamás registradas”. 
Cada año, sobre el océano Ártico se forma una gran cubierta de hielo flotante que después se derrite, pero la velocidad a la que se produce el deshielo se ha acelerado. Durante los últimos 30 años los satélites que observan el Ártico han sido testigo de reducciones en la cubierta mínima de hielo al final del verano: de los 8 millones de kilómetros cuadrados a principios de los años ochenta, al mínimo histórico de menos de 4,24 millones de kilómetros cuadrados en 2007. 
Antes de la llegada de los satélites era muy complicado hacer mediciones del hielo marino: no sólo es difícil llegar al Ártico, sino que en la región es frecuente el mal tiempo y la oscuridad se prolonga durante largos periodos. Los radares en los satélites de observación de la Tierra, como Envisat, de la ESA, están especialmente preparados para vigilar las regiones polares porque pueden tomar imágenes independientemente de las nubes y de la oscuridad. En las próximas semanas la ESA seguirá vigilando la situación en el Ártico con sus satélites Envisat, CryoSat y SMOS.


Satellite measurements show we are heading for another year of below-average ice cover in the Arctic. As sea ice melts during the summer months, two major shipping routes have opened in the Arctic Ocean. In 2008 satellites saw that the Northwest Passage and the Northern Sea Route were open simultaneously for the first time since satellite measurements began in the 1970s – and now it has happened again. 
While the Northern Sea Route above Russia also known as the Northeast Passage has been open to shipping traffic since mid-August, recent satellite data show that the most direct course in the Northwest Passage now appears to be navigable as well. Located in the Canadian Arctic Archipelago, the Northwest Passage can be a short cut for shipping between Europe and Asia – but with the opening of the sea route comes the potential for both sovereignty claims and marine species migration across the Arctic Ocean. 
In 2007, Arctic sea ice hit a record low since satellite measurements began nearly 30 years before. That same year, the historically impassable Northwest Passage opened for the first time. Unusual weather contributed to 2007’s record ice loss: skies opened over the central Arctic Ocean and wind patterns pushed warm air into the region, promoting a strong melt. 
Weather patterns have been different this year, but the early opening of the passages indicates that we could be about to hit a new record low in ice cover. Open Northern Sea Route “The minimum ice extent is still three to four weeks away, and a lot depends on the weather conditions over the Arctic during those weeks,” says Leif Toudal Pedersen, a senior scientist at the Danish Meteorological Institute. “Whether we reach an absolute minimum or not, this year again confirms that we are in a new regime with substantially less summer ice than before. “The last five summers ar11:39 05/09/2011e the five minimum ice extent summers on record.” 
Every year, the Arctic Ocean experiences the formation and then melting of vast amounts of floating ice, but the rate of overall loss has accelerated. During the last 30 years, satellites observing the Arctic have witnessed reductions in the minimum ice extent at the end of summer from around 8 million sq km in the early 1980s to the historic minimum of less than 4.24 million sq km in 2007. 
Before the advent of satellites, obtaining measurements of sea ice was difficult: the Arctic is both inaccessible and prone to long periods of bad weather and extended darkness. Radars on Earth observation satellites such as ESA’s Envisat are particularly suited to monitoring polar regions because they can acquire images through clouds and darkness. In the coming weeks, ESA will continue to monitor the situation in the Arctic with its Envisat, CryoSat and SMOS satellites. 

Tomado de ESA/Taken from ESA

sábado, 5 de marzo de 2011

Floraciones de fitoplancton al borde del hielo en el Artico/Artic ice-edge phytoplankton blooms

Los actuales cambios climáticos en el Ártico helado, podrían tener un impacto significativo en la floración del fitoplancton, con implicaciones importantes para el ecosistema ártico.
Durante la primavera y verano árticos, el mar helado se funde y se fracciona. El agua dulce procedente del hielo fundido forma una capa y flota sobre el agua salada más densa que hay debajo. Esta estratificación de la columna de agua junto con la luz solar estacional provoca la floración del plancton, que a menudo forma largas y estrechas (20-100 km) bandas a lo largo del hielo que se retira. En el pasado, estas floraciones se estudiaban durante cruceros científicos y se centraron principalmente en regiones como el Mar de Barents entre Noruega y el archipiélago Svalbard o en el estrecho de Berng cerca de Alaska.
Las investigacionbes llevadas a cabo por Mahé Perrette, Andrew Yool, Graham Quartly y Ekaterina Popova del Centro Nacional de Oceanografía (Reino Unido) han utilizado moderna tecnología espacial (satélites SeaWiFs y MODIS) en combinación con información procedente del Centro Nacional de Datos de Hielo y Nieve (E.E.U.U.) para observar y seguir desde el espacio, floraciones en los bordes del hielo con alta resolución espacial sobre grandes áreas y a lo largo de largos periodos de tiempo.
Han encontrado que estas floraciones tienen lugar en el Artico de primavera a fines de verano en todas las zonas cubiertas estacionalmente de hielo . Se observaron floraciones en un 77-89% de las zonas para las que disponían de datos adecuados. Las floraciones alacanzaban su máximo 20 días después de la retirada del hielo, y formaban largas cintas o bandas, en ocasiones de más de 100 km) a lo largo del borde del hielo.
Según el Dr Yool, "nuestros hallazgos demuestran la fuerte conexión biofísica entre la propagación de las floraciones y la fusión del hielo, la cual es independiente de la dirección concreta de la retirada de hileo"
La importancia de estos hallazgos radica en que muestran que los futuros cambios del hielo ártico derivados del cambio climático, podrían tener un impacto significativo en la aparición de floraciones de fitoplancton, así como sobre los animales situados más arriba en la cadena alimentaria de la que dependen, como es el caso de los peces.

Ongoing climate-driven changes to the Arctic sea-ice could have a significant impact on the blooming of phytoplankton with important implications for the Arctic ecosystem.
During the Arctic spring and summer, sea-ice melts and breaks up. Freshwater from melting ice forms a blanket over the denser, saltier water below. This stratification of the water column, along with seasonal sunshine, triggers the appearance of phytoplankton blooms, which often form long but narrow (20-100 km) bands along the receding ice-edge. In the past they have been studied largely during reserachs cruises and were focused on regions such as the Barents Sea between Norway and the Svalbard Archipelago, and the Bering Shelf bordering Alaska.
The research conducted by Mahé Perrette, Andrew Yool, Graham Quartly and Ekaterina Popova of the National Oceanography Centre (UK), has used modern satellite technology (NASA's SeaWiFs and MODIS satellites) as well as information on sea ice concentrations obtained from the US National Snow and Ice Data Center (NSIDC), to observe and monitor ice-edge blooms at high spatial resolution over large areas and extended periods of time from space.
They found that ice-edge blooms occurred in the Artic in all seasonally ice-covered areas and from spring to late summer. They observed ice-edge blooms in 77-89% of locations for which they had adequate data. The blooms usually peaked within 20 days of ice retreat, sometimes forming long belts along the ice edge (greater than 100 km).
"Our findings demonstrate strong biophysical linkage between bloom propagation and sea-ice melt back, which is independent of the actual direction of retreat," said Dr Yool.
These findings are important because they indicate that future change in Arctic sea- ice resulting from climate change could significantly impact the occurrence of phytoplankton blooms as well as the animals further up the food chain that ultimately depend upon them, including fish.

Tomado de/Taken from Science Daily

La publicación completa/The full paper

Resumen de la publicación/Abstract of the paper
Near-ubiquity of ice-edge blooms in the Arctic
M. Perrette, A. Yool, G. D. Quartly and E. E. Popova1
Biogeosciences, 8, 515-524, 2011
www.biogeosciences.net/8/515/2011/
doi:10.5194/bg-8-515-2011
Abstract. Ice-edge blooms are significant features of Arctic primary production, yet have received relatively little attention. Here we combine satellite ocean colour and sea-ice data in a pan-Arctic study. Ice-edge blooms occur in all seasonally ice-covered areas and from spring to late summer, being observed in 77–89% of locations for which adequate data exist, and usually peaking within 20 days of ice retreat. They sometimes form long belts along the ice-edge (greater than 100 km), although smaller structures were also found. The bloom peak is on average more than 1 mg m−3, with major blooms more than 10 mg m−3, and is usually located close to the ice-edge, though not always. Some propagate behind the receding ice-edge over hundreds of kilometres and over several months, while others remain stationary. The strong connection between ice retreat and productivity suggests that the ongoing changes in Arctic sea-ice may have a significant impact on higher trophic levels and local fish stocks.

martes, 7 de septiembre de 2010

Adiós a las noches frías/Goodbye to cold nights

Debido al impacto que los extremos climáticos ocasionan en la agricultura y la salud en España, investigadores de la Universidad de Salamanca (USAL) han analizado las dos variables más representativas de estos extremos térmicos de 1950 a 2006: los días cálidos y las noches frías. Los resultados para la Península Ibérica indican un aumento de los días cálidos superior al del resto del planeta, y una disminución de las noches frías.
Son pocos los estudios que se han centrado en los extremos climáticos y en los cambios que se están produciendo en las temperaturas máximas y mínimas o en las variables de días cálidos y noches frías. Hasta ahora, la mayoría de las investigaciones habían analizado los cambios de temperatura promedio a escala global. Estos resultados indicaban un aumento provocado “lo más probable” por factores antropogénicos.
El nuevo estudio, publicado en la revista Climatic Change, ha permitido analizar desde el punto de vista físico las causas de las variaciones de los extremos climáticos, es decir, “qué cambios se están produciendo en las masas de aire que llegan a la Península Ibérica, así como en la temperatura del mar”, asegura Concepción Rodríguez, autora principal del trabajo e investigadora en el Departamento de Física General y Atmósfera de la USAL.
“Los resultados indican una tendencia creciente en la frecuencia de días cálidos y una disminución en la frecuencia de las noches frías. La tendencia de disminución de noches frías se corresponde con la obtenida a escala global según el IV Informe del Panel Intergubernamental sobre Cambio Climático (IPCC). Sin embargo, el crecimiento de días cálidos en la Península Ibérica es superior que el obtenido globalmente para todo el planeta”, señala la científica.
Para explicar estas diferencias, el equipo científico vinculó el aumento de días cálidos con índices de teleconexión climática, que representan la variabilidad de las características de la atmósfera y de los océanos. “Los días cálidos están relacionados con los patrones de teleconexión atmosféricos, mientras que las noches frías dependen, principalmente, de la temperatura del mar (del Atlántico norte)”, explica la investigadora.
El tiempo .que trae la masa de aire desde el norte de África es la principal causa del aumento de días cálidos “El tipo de tiempo que provoca más noches frías es la depresión sobre del golfo de Génova, que aporta aire seco y frío del centro de Europa a España", argumenta Rodríguez, quien afirma que los cambios en el número de días cálidos y noches frías son más pronunciados en el suroeste y el noreste de la Península Ibérica.. “Una de las causas probables de estos cambios es la variación de la temperatura superficial del mar en el Atlántico oriental”, puntualiza

Given the impact of climatic extremes on agriculture and health in Spain, researchers at the University of Salamanca (USAL) have analysed the two factors most representative of these thermal extremes between 1950 and 2006 - warm days and cold nights. The results for mainland Spain show an increase in the number of warm days greater than that for the rest of the planet and a reduction in the number of cold nights.
Few studies to date have focused on climatic extremes and the changes occurring in maximum and minimum temperatures and in warm day and cold night variables. Until now, most research studies had analysed average temperature changes on a global scale. These results indicated an increase "most probably" caused by human factors.
The new study, published in the journal Climatic Change, has made it possible to analyse the causes of the variations in climatic extremes from a physical point of view, in other words "which changes are taking place in the air masses reaching the Iberian Peninsula, as well as sea temperature", as Concepción Rodríguez, lead author of the study and a researcher at the General and Atmospheric Physics Department at the USAL, tells SINC.
"The results indicate an increasing trend in the frequency of warm days and a reduction in the frequency of cold nights. The trend towards the reduction of cold nights correlates with that obtained at global level, according to the Fourth Assessment Report of the Intergovernmental Panel on Climate Change (IPCC). However, the increase in warm days in mainland Spain is higher than the number obtained globally for the planet as a whole", the scientist explains.
In order to explain these differences, the scientific team linked the increase in warm days with climate teleconnection indices, which show the variability of atmospheric and oceanic characteristics. "Warm days are related to atmospheric teleconnection patterns, while cold nights are caused, principally, by the temperature of the sea (in the North Atlantic)", the researcher adds.
Weather that draws air masses up from the north of Africa is the leading cause of warm days. "The type of weather that causes more cold nights is the depression over the Gulf of Genoa, which brings cold and dry air from central Europe to Spain", explains Rodríguez, who says that the change in the number of warm days and cold nights is much more pronounced in the south west and north east of the Iberian Peninsula. "One of the most probable causes of these changes is the variation in the surface temperature of the sea in the eastern Atlantic", she points out.

Tomado de Plataforma SINC (Español)/AlphaGalileo (English)

Abstract of the paper
Trends in warm days and cold nights over the Iberian Peninsula: relationships to large-scale variables
Concepción Rodríguez-Puebla, Ascensión H. Encinas, Luis Alberto García-Casado and Susana Nieto
Climatic Change, Volume 100, Numbers 3-4, 667-684, DOI: 10.1007/s10584-009-9721-0

Abstract
The aims of this study are to identify the trend of warm days and cold nights over the Iberian Peninsula and to connect the variations with large-scale variables. The reasons for performing this analysis are the effects that extremes events have on different ecosystems. Here, we present the results on spatial and temporal variability of warm days (TX90), or those exceeding the 90th percentile of maximum temperature, and cold nights (TN10), or those falling below the 10th percentile of minimum temperature. The extreme indices were derived from daily observations at stations and gridded data over land area for the period 1950 to 2006. Significant trends of more warm days and fewer cold nights were found. The trend to fewer cold nights is within the interval of global results given by the IPCC AR4 report; however, the trend to warm days is greater than the corresponding global trend. The influence of large-scale variables on these extreme indices was examined by means of the Empirical Orthogonal Function, correlation, composite maps and multiple regression analyses. Changes in TX90 are connected with the Scandinavian teleconnection index and a preferred mode of geopotential height at 500 hPa over the North Atlantic. Changes in TN10 are connected with the East Atlantic teleconnection index and the leading mode of Sea Surface Temperature (SST) variability over the North Atlantic area. Based on the links between the extreme indices and the large-scale variables we derived statistical models to describe the response of TX90 and TN10 to atmospheric circulation and SST variations. The models characterized the observed variations of TX90 and TN10 reasonably well. The results of this study encourage us to analyze, in further work, how temperature extremes might change over the Iberian Peninsula under warmer climate conditions.